


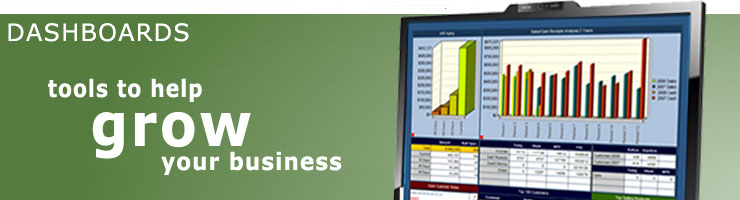
Easy, Affordable Management Dashboards
The C/Books Dashboards are a "new feature" added to Version 5.6.5 of C/Books. The primary objective is help companies monitor and manage their business. Unlike other dashboard products the Conetic Dashboard is already configured and ready to deliver C/Books accounting data to you in a highly intuitive graphical presentation. The Conetic dashboards removes the time consuming process of collecting information. The Dashboard is sample and easy-to-use. "If you can navigate a web page, you and use our dashboards". The "drill-down" analysis and customization capabilities make the this Dashboard suited for organizations of all sizes, including large corporations, individual departments within companies, and small and mid-size businesses.
Make Quicker, Better-Informed Business Decisions
Conetic Dashboard helps companies by allowing them to quickly identify and act on issues and opportunities. The predefined Accounts Payable and Accounts Receivable Dashboards focus on controlling revenues and expenses. While also visually displaying account activity. Conetic Dashboard takes advantage of graphical interface techniques to simplify the process of transforming a company's complex data into easy-to-understand insight, leading to faster, and better-informed business decisions.
Transform Raw Data Into Meaningful Insight
Conetic Dashboard allows companies to quickly and easily turn their raw business data into key performance indicators, such as current year Sales vs. previous year Sales, average days for customers to pay by month (two year comparison) etc.
"Drill-Down" and "Slice-and-Dice" Analysis Capabilities Drill-Down analysis is used to trace details account activity. A single balance total, Purchase or payment total can be exploded into a detail spreadsheet style grid, just by a point-and-click. The same exploded grid can also be exported to excel, just a point-and-click. Users can point-and-click on a multitude of links to better analyze the data. In addition the accounting data, the dashboards have been designed to enable users to better manage accounts by viewing “open” notes and memos, recording calls, adding contacts for an account or even drilling to a "Google Map" -- showing the locations of the account.
Data fully exposed .....
Aside from the visual graphic display of data, the associated drill-down reports provide insight to raw data, faster and easier than ever before. Tracking an invoice, payments, and gross margin is just a few clicks away. This type of information can help control cost, while help grow the bottom line. Point-click ...and go!
Quick & Easy Implementation
C/Books Version 5.6 or greater is required. Conetic Dashboard is integrated with the C/Books Accounting system. Systems that are running an older version of C/Books can upgrade to the current version of C/Books. However, all existing transaction history can be used to collect statistics, which in turn can be used with the Dashboards.
Customization and Enhancement
Conetic Dashboard's underlying technology is ideal for companies to customize or enhance our standard dashboards to their unique business model. All Dashboard source code scripts, and reports are distribute with the product. The scripts/reports have all been written using the Conetic "Grace language", which makes them fully editable by using a text editor or our "Visual Grace Editor" tool. Conetic's Dashboard offers a number of features designed to seamlessly integrate with each business.
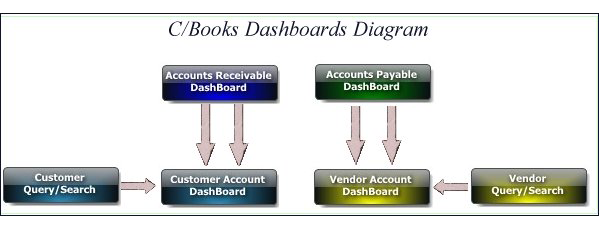
The dashboards are made up of 4 Dashboards/displays and 2 module search engines. (see diagram below)
Accounts Receivable Dashboard Accounts Receivable Dashboard contains an over view of "Receivables, Cash Receipt and Order Entry" acitivity. Items displayed are:
- A/R Aging, dollars by aging period and number of open invoices by aging period(graph & grid)
- 2 Year sales and cash activity by period (graph)
- 2 year average days to pay by period (graph)
- Top 100 Customers (grid)
- Top 100 Customers (graph)
- Open Customer Notes(grid)
- Invoice dollars by Today, week, mtd, and ytd (grid)
- Cash Receipts dollars by Today, week, mtd, and ytd (grid)
- Credit Memos dollars by Today, week, mtd, and ytd (grid)
- Order dollars by Today, week, mtd, and ytd (grid)
- Activity Current year customers
- Inactivity Current year customers
- Activity Previous year customers
- Inactivity Previous year customers
Accounts Payble DashboardAccounts Payble Dashboard contains an over view of "Payables, Cash Disbursement and Purchase Order" acitivity. Items displayed are:
- A/P Aging, dollars by aging period and number of open vouchers by aging period(graph & grid)
- 2 Year purchases and payment activity by period (graph)
- Top 100 Vendors (grid)
- Top 100 Vendors (graph)
- Open Vendor Notes(grid)
- Voucher dollars by Today, week, mtd, and ytd (grid)
- Cash Disbursement payments dollars by Today, week, mtd, and ytd (grid)
- Debit Memos dollars by Today, week, mtd, and ytd (grid)
- Purchase Order dollars by Today, week, mtd, and ytd (grid)
- Activity Current year vendors
- Inactivity Current year vendors
- Activity Previous year vendors
- Inactivity Previous year vendors
Learn More! To learn more about how Conetic Dashboards can benefit your organization, Contact Us and we will be happy to answer your questions or provide you with a live demo that highlights key features and capabilities. We look forward to hearing from you!
Feel free to ask us how you can view your companies Dashboard information from your pda or cell phone!